728x90
Prometheus
- Metrics를 수집하고 모니터링 및 알람에 사용되는 오픈소스 Application
- pull 방식의 구조와 다양한 Metric Exporter 제공
- 시계열 DB에 Metrics 저장(조회 가능 = Query)
- 다운로드
Download | Prometheus
An open-source monitoring system with a dimensional data model, flexible query language, efficient time series database and modern alerting approach.
prometheus.io
- 실행하기
- prometheus,. yml 수정
- 모니터링할 job을 적어준다.

prometheus의 yml 설정파일 수정
- prometheus 실행(윈도우 같은 경우 exe파일 실행)
- prometheus,. yml 수정
Grafana
- 데이터 시간화, 모니터링 및 분석을 위한 오픈소스 Application
- 시계열 데이터를 시각화하기 위한 대시보드 제공
- https://grafana.com/grafana/download
Download Grafana
Overview of how to download and install different versions of Grafana on different operating systems.
grafana.com
grafana 설치후 실행한뒤에 localhost:3000 접속
- admin , admin 을 입력한다.
- Grafana - Promethus 연동하기
- 설정 - add datasource - promethus 클릭
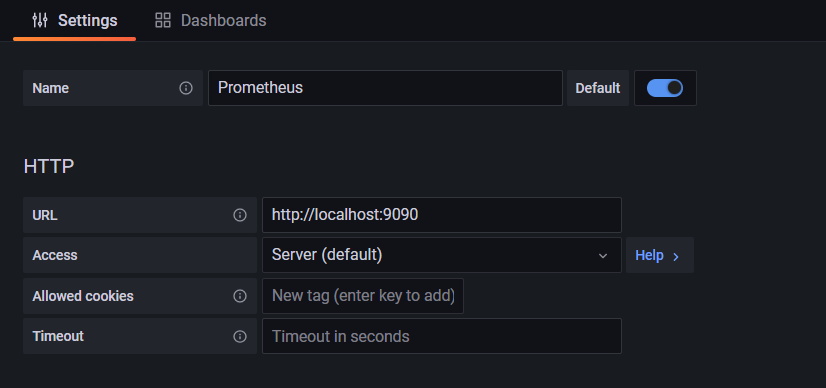
URL에 promethus URL 지정후 save 
import 클릭하여 그라파다에서 제공하는 dashboard를 임포트 받는다 
dashboad를 링크를 복사하고 붙여넣어 사용하면된다. 
해당 지표값을 내 프로메테우스에 있는 지표로 변경하여 동작시킨다
728x90
'Spring Cloud로 개발하는 MSA > Microservice 모니터링' 카테고리의 다른 글
| Micrometer (0) | 2022.02.11 |
|---|