728x90
이제 프로메테우스가 애플리케이션의 /actuator/prometheus를 호출해서 메트릭을 주기적으로 수집하도록 설정해 보자.
프로메테우스 폴더에 있는 prometheus.yml 파일을 수정하자.
prometheus.yml
# my global config
global:
  scrape_interval: 15s # Set the scrape interval to every 15 seconds. Default is every 1 minute.
  evaluation_interval: 15s # Evaluate rules every 15 seconds. The default is every 1 minute.
  # scrape_timeout is set to the global default (10s).

# Alertmanager configuration
alerting:
  alertmanagers:
    - static_configs:
        - targets:
          # - alertmanager:9093

# Load rules once and periodically evaluate them according to the global 'evaluation_interval'.
rule_files:
  # - "first_rules.yml"
  # - "second_rules.yml"

# A scrape configuration containing exactly one endpoint to scrape:
# Here it's Prometheus itself.
scrape_configs:
  # The job name is added as a label `job=<job_name>` to any timeseries scraped from this config.
  - job_name: "prometheus"

    # metrics_path defaults to '/metrics'
    # scheme defaults to 'http'.

    static_configs:
      - targets: ["localhost:9090"]
  - job_name: "spring-actuator"
    metrics_path: '/actuator/prometheus'
    scrape_interval: 1s
    static_configs:
      - targets: ['localhost:8080']
- -job_name: "spring-actuator"부터 추가되었다.
- 앞의 띄어쓰기 2칸에 유의하자
- job_name : 수집하는 이름이다. 임의의 이름을 사용하면 된다.
- metrics_path : 수집할 경로를 지정한다.
- scrape_interval : 수집할 주기를 설정한다.
- targets : 수집할 서버의 IP, PORT를 지정한다.
- 이렇게 설정하면 프로메테우스는 다음 경로(http://localhost:8080/actuator/prometheus)를 1초에 한 번씩 호출해서 애플리케이션의 메트릭들을 수집한다.
주의
scrape_interval 여기서는 예제를 빠르게 확인하기 위해서 수집 주기를 1s로 했지만, 수집 주기의 기본 값은 1m 이다. 수집 주기가 너무 짧으면 애플리케이션 성능에 영향을 줄 수 있으므로 운영에서는 10s ~ 1m 정도를 권장한다. (물론 시스템 상황에 따라서 다르다.)
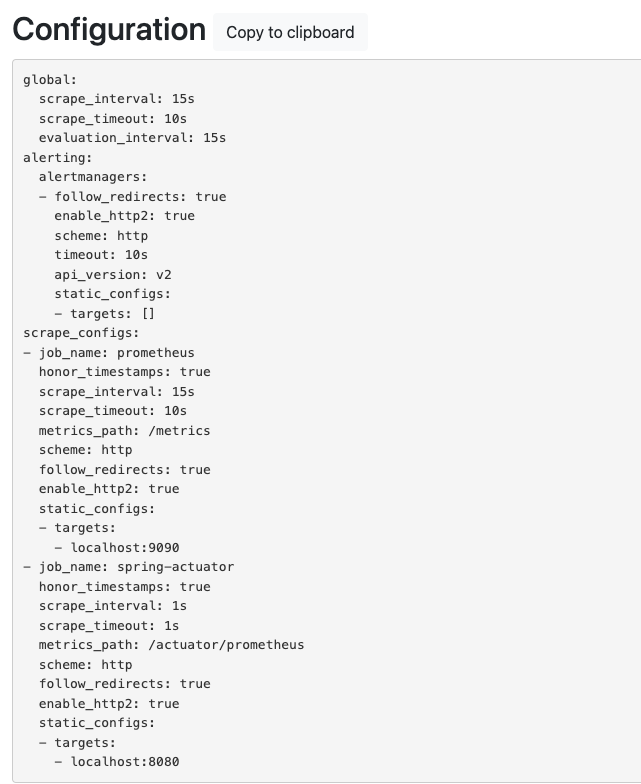
프로메테우스 연동 확인
프로메테우스 메뉴 Status -> Configuration에 들어가서 prometheus.yml 에 입력한 부분이 추가되어 있는지 확인해 보자..
http://localhost:9090/config
프로메테우스 메뉴 Status Targets에 들어가서 연동이 잘 되었는지 확인하자.
http://localhost:9090/targets

- prometheus : 프로메테우스 자체에서 제공하는 메트릭 정보이다. (프로메테우스가 프로메테우스 자신의 메트릭을 확인하는 것이다.)
- spring-actuator : 우리가 연동한 애플리케이션의 메트릭 정보이다.
- State 가 UP 으로 되어 있으면 정상이고, DOWN 으로 되어 있으면 연동이 안된 것이다
프로메테우스를 통한 데이터 조회

- jvm_info 를 검색창에 넣고 실행해보면 수집한 메트릭을 조회할 수 있다.
728x90
'스프링 부트(핵심 원리와 활용)' 카테고리의 다른 글
| Ch08. 마이크로미터, 프로메테우스, 그라파나 - 프로메테우스(기본 기능) (0) | 2023.05.08 |
|---|---|
| Ch08. 마이크로미터, 프로메테우스, 그라파나 - 프로메테우스(기본 기능) (0) | 2023.05.05 |
| Ch08. 마이크로미터, 프로메테우스, 그라파나 - 프로메테우스(애플리케이션 설정) (0) | 2023.04.30 |
| Ch08. 마이크로미터, 프로메테우스, 그라파나 - 프로메테우스와 그라파나 소개 (0) | 2023.04.26 |
| Ch08. 마이크로미터, 프로메테우스, 그라파나 - 다양한 메트릭 (0) | 2023.04.26 |