CPU, JVM, 커넥션 사용 등등 수많은 지표들을 어떻게 수집해야 할까?
개발자가 각각의 지표를 직접 수집해서 그것을 마이크로미터가 제공하는 표준 방법에 따라 등록하면 된다. 다행히도 마이크로미터는 다양한 지표 수집 기능을 이미 만들어서 제공한다. 그리고 스프링 부트 액츄에이터는 마이크로미터가 제공하는 지표 수집을 @AutoConfiguration을 통해 자동으로 등록해 준다..
쉽게 이야기해서 스프링 부트 액츄에이터를 사용하면 수많은 메트릭(지표)을(지표) 편리하게 사용할 수 있다. 이제 기본으로 제공하는 메트릭들을 확인해 보자.
아직 모니터링 툴을 연결한 것은 아니고, 등록된 메트릭들을 확인해 보는 단계이다.
metrics 엔드포인트
metrics 엔드포인트를 사용하면 기본으로 제공되는 메트릭들을 확인할 수 있다.
http://localhost:8080/actuator/metrics
{
	"names": [
        "application.ready.time",
        "application.started.time",
        "disk.free",
        "disk.total",
        "executor.active",
        "executor.completed",
        "executor.pool.core",
        "executor.pool.max",
        "executor.pool.size",
        "executor.queue.remaining",
        "executor.queued",
        "hikaricp.connections",
        "hikaricp.connections.acquire",
        "hikaricp.connections.active",
        "hikaricp.connections.creation",
        "hikaricp.connections.idle",
        "hikaricp.connections.max",
        "hikaricp.connections.min",
        "hikaricp.connections.pending",
        "hikaricp.connections.timeout",
        "hikaricp.connections.usage",
        "http.server.requests",
        "http.server.requests.active",
        "jdbc.connections.active",
        "jdbc.connections.idle",
        "jdbc.connections.max",
        "jdbc.connections.min",
        "jvm.buffer.count",
        "jvm.buffer.memory.used",
        "jvm.buffer.total.capacity",
        "jvm.classes.loaded",
        "jvm.classes.unloaded",
        "jvm.compilation.time",
        "jvm.gc.live.data.size",
        "jvm.gc.max.data.size",
        "jvm.gc.memory.allocated",
        "jvm.gc.memory.promoted",
        "jvm.gc.overhead",
        "jvm.info",
        "jvm.memory.committed",
        "jvm.memory.max",
        "jvm.memory.usage.after.gc",
        "jvm.memory.used",
        "jvm.threads.daemon",
        "jvm.threads.live",
        "jvm.threads.peak",
        "jvm.threads.states",
        "logback.events",
        "process.cpu.usage",
        "process.files.max",
        "process.files.open",
        "process.start.time",
        "process.uptime",
        "system.cpu.count",
        "system.cpu.usage",
        "system.load.average.1m",
        "tomcat.sessions.active.current",
        "tomcat.sessions.active.max",
        "tomcat.sessions.alive.max",
        "tomcat.sessions.created",
        "tomcat.sessions.expired",
        "tomcat.sessions.rejected"
	]
}
- 액추에이터가 마이크로미터를 통해서 등록한 기본 메트릭들을 확인할 수 있다.
자세히 확인하기
http://localhost:8080/actuator/metrics/{name}
1) JVM 메모리 사용량 확인하기
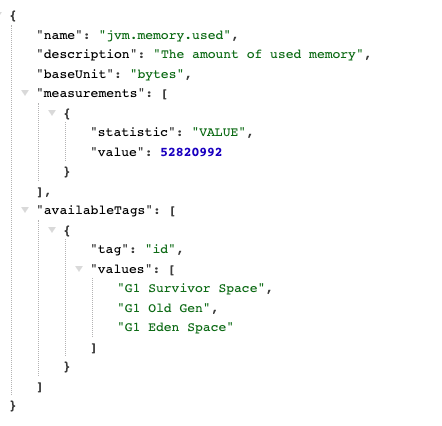
http://localhost:8080/actuator/metrics/jvm.memory.used

- 현재 메모리 사용량을 확인할 수 있다.
Tag 필터
availableTags를 보면 다음과 같은 항목을 확인할 수 있다.
- tag:area , values[heap, nonheap]
- tag:id , values[G1 Survivor Space, ...]
tag=KEY:VALUE과 같은 형식을 사용해 정보를 필터링해서 확인할 수 있다.
http://localhost:8080/actuator/metrics/jvm.memory.used? tag=area:heap
http://localhost:8080/actuator/metrics/jvm.memory.used?tag=area:nonheap

tag 를 사용해서 힙 메모리, 힙이 아닌 메모리로 분류해서 데이터를 확인할 수 있다.
2) HTTP 요청수를 확인
http://localhost:8080/actuator/metrics/http.server.requests
{
"name": "http.server.requests",
"baseUnit": "seconds",
"measurements": [
{
"statistic": "COUNT",
"value": 14
},
{
"statistic": "TOTAL_TIME",
"value": 0.197887626
},
{
"statistic": "MAX",
"value": 0.021261125
}
],
"availableTags": [
{
"tag": "exception",
"values": [
"none"
]
},
{
"tag": "method",
"values": [
"GET"
]
},
{
"tag": "error",
"values": [
"none"
]
},
{
"tag": "uri",
"values": [
"/actuator/metrics/{requiredMetricName}",
"/log",
"/actuator",
"/actuator/metrics",
"/**"
]
},
{
"tag": "outcome",
"values": [
"CLIENT_ERROR",
"SUCCESS"
]
},
{
"tag": "status",
"values": [
"404",
"200"
]
}
]
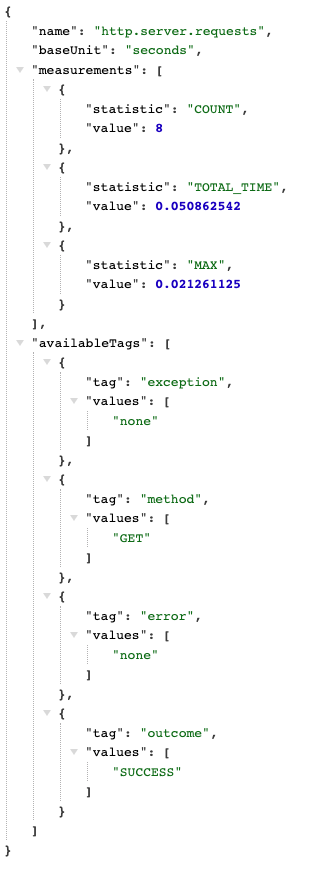
}/log 요청만 필터 (사전에 /log 요청을 해야 확인할 수 있음)
http://localhost:8080/actuator/metrics/http.server.requests?tag=uri:/log
{
    "name": "http.server.requests",
    "baseUnit": "seconds",
    "measurements": [
        {
        	"statistic": "COUNT",
       		"value": 8
        },
        {
            "statistic": "TOTAL_TIME",
            "value": 0.050862542
        },
        {
            "statistic": "MAX",
            "value": 0.021261125
        }
    ],
    "availableTags": [
    	{
        	"tag": "exception",
        	"values": [
        		"none"
        	]
        },
        {
            "tag": "method",
            "values": [
            	"GET"
            ]
        },
        {
            "tag": "error",
            "values": [
            	"none"
            ]
        },
        {
            "tag": "outcome",
            "values": [
            	"SUCCESS"
            ]
        },
        {
            "tag": "status",
            "values": [
            	"200"
            ]
        }
    ]
}
/log 요청 & HTTP Status = 200
http://localhost:8080/actuator/metrics/http.server.requests?tag=uri:/log&tag=status:200
'스프링 부트(핵심 원리와 활용)' 카테고리의 다른 글
| Ch08. 마이크로미터, 프로메테우스, 그라파나 - 프로메테우스와 그라파나 소개 (0) | 2023.04.26 |
|---|---|
| Ch08. 마이크로미터, 프로메테우스, 그라파나 - 다양한 메트릭 (0) | 2023.04.26 |
| Ch08. 마이크로미터, 프로메테우스, 그라파나 - 마이크로미터 소개 (0) | 2023.03.29 |
| Ch07. 액츄에이터 - 액츄에이터와 보안 (0) | 2023.03.29 |
| Ch07. 액츄에이터 - HTTP 요청 응답 기록 (0) | 2023.03.29 |